
Les élus de la majorité municipale de Sèvres se sont réunis ce 30 novembre 2013 après le traumatisme qu’a constitué l’annonce de l’hospitalisation de François Kosciusko-Morizet.
Bouleversés par la conscience de son état de santé, ils lui réitèrent leur amitié fidèle et lui adressent leurs vœux de prompt et total rétablissement et attendent son retour. Leurs pensées vont également à sa famille qu’ils assurent de tout leur soutien. A l’issue d’une (...)
Section Ump de Sèvres
Le site de la section UMP de Sèvres.
Derniers articles
-
Campagne Municipal
30 novembre 2013, par -
François Kosciusko-Morizet hospitalisé
26 novembre 2013, parA l’attention des adhérents et sympathisants UMP de Sèvres
Bonjour à tous
François Kosciusko-Morizet, notre Maire, a été hospitalisé en urgence ce week-end. Nous attendons de ses nouvelles et je vous en tiendrai informés.
Bien évidemment la campagne est interrompue pour le moment.
Nous souhaitons à François, du fond du coeur tous nos voeux de prompt rétablissement.
Avec mes amitiés
Jean-Pierre Fortin
Délégué UMP pour Sèvres
2e Adjoint au (...) -
 La Fin de la démocratie locale13 novembre 2013, par
Le transfert du budget et de nombreuses compétences à la métropole du grand Paris empêchera les habitants de se faire entendre.
La métropole du Grand Paris est ce monstre administratif que les seuls socialistes essayent d’imposer à la zone dense de la région Ile-de-France. Regroupant 126 villes et 6,5 millions d’habitants elle a vocation à faire de ces communes des arrondissements de Paris de fait.
Les socialistes remplacent la démocratie par la technocratie, et pour cause, (...) -
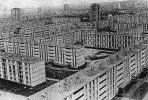 Le plan des socialistes pour bétonner Sèvres.17 octobre 2013, par
Le projet de loi sur les métropoles, porté par les socialistes, dépossédant les sévriens de quelconque moyen d’agir sur leur ville, pourrait conduire au bétonnage de nos communes ; explications.
« Un monstre administratif », c’est ainsi que Roger Frey, alors ministre de l’intérieur du général de Gaulle avait qualifié le département de la Seine. Jusqu’en 1964, Paris et la petite couronne étaient administrés par seulement deux entités, la Seine et « la Seine et Oise (...) -
 La Campagne de François Kosciusko-Morizet lancée le 5 octobre25 septembre 2013, par
Le 5 octobre prochain, à 11h l’association « Les Jeunes avec FKM » invite le candidat UMP-UDI à un grand apéro de rentrée sur la place du théâtre (Entre le Balto et Christelle jouet). L’occasion idéale pour lançer une campagne sous le signe du rassemblement.
Dimanche 5 Octobre, plus d’une centaine de personnes sont attendues sur la place du Théâtre pour soutenir la candidature de notre maire François Kosciusko-Morizet. Leader incontesté de la majorité municipale, ce (...)